Drawings below are first made from photographs. The drawings should then be compared, under a microscope, with the preserved squid from which the photographs were made. This greatly reduces the errors that can occur in interpreting the photophore distributions. Use caution, therefore, on this page in viewing the color and distribution of the dots (representing photophores) as their distributions have not yet been confirmed by comparing the drawings against the actual specimen under the microscope.
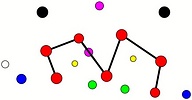
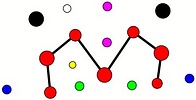
Table. Ventral view of the funnel-groove region of A. atlantica. Top tier - Funnel groove showing photophores of funnel groove and surrounding tissue. Middle tier - In the photograph, white dots placed over the "white" photophores of the funnel groove. Black dots placed over the most posteromedial "red" photophores of the ventral head to mark the anterolateral edges of the funnel groove. Bottom tier - Same pattern of dots as in photographs. Colors, lines - Aid in comparison of patterns between species. Open dots - Represent photophores that are either of uncertain status as "white" photophores or have variable presence. Images by R. Young. Comparison of white photophore patterns for all Abraliopsis species can be found here.
| Mature male, ? mm ML | Mature male, ? mm ML |
|---|---|
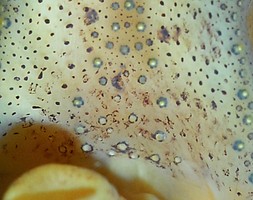 | 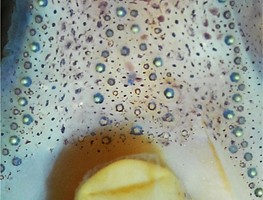 |
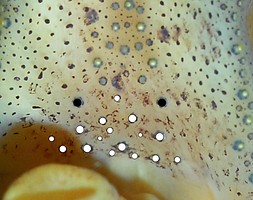 | 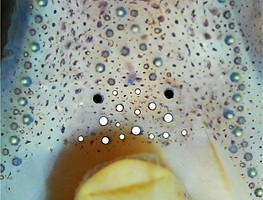 |
 |  |
Comments:
Summary of photophore distributions. (photophore definitions found here)
White Patch (funnel groove). Complex-2 pattern (red, green, blue; + yellow, maroon at larger ML).


 Go to quick links
Go to quick search
Go to navigation for this section of the ToL site
Go to detailed links for the ToL site